Rebecca Mishik, Ph.D. - November 2026
There are three core measures of whether a state’s economy is growing. Is the population growing? Are jobs growing? Is economic output growing? Measured over the long run, Virginia has grown the least on all three among the six Southeast states that compete most for the same jobs and investment.
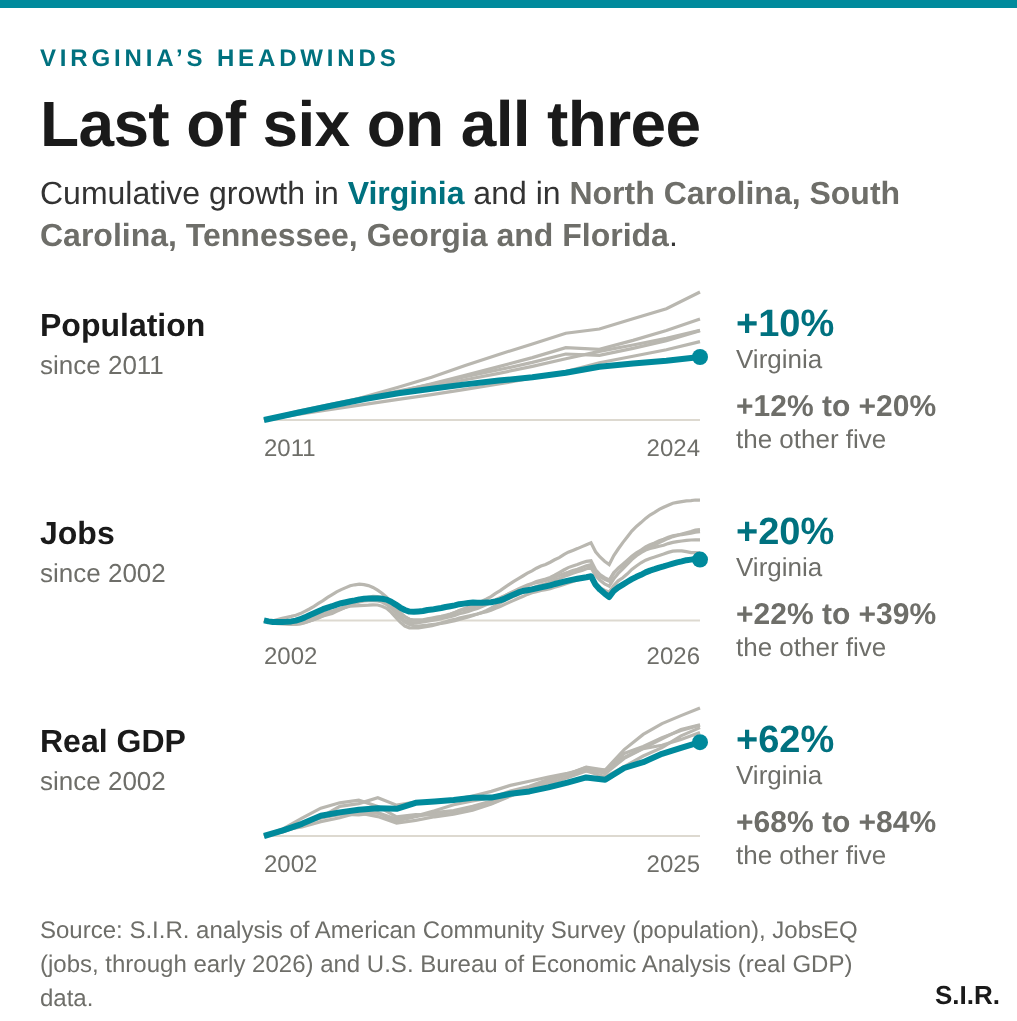
The comparison states are North Carolina, South Carolina, Tennessee, Georgia and Florida. Population is measured from 2011; jobs and economic output from 2002.
It was not always this way
The long view shows when the trend began. As recently as 2013, Virginia led all six states in job growth since 2002 and ranked second in growth of economic output. It slipped to last on output in 2016, and to last on jobs and population in 2020. It has stayed there.
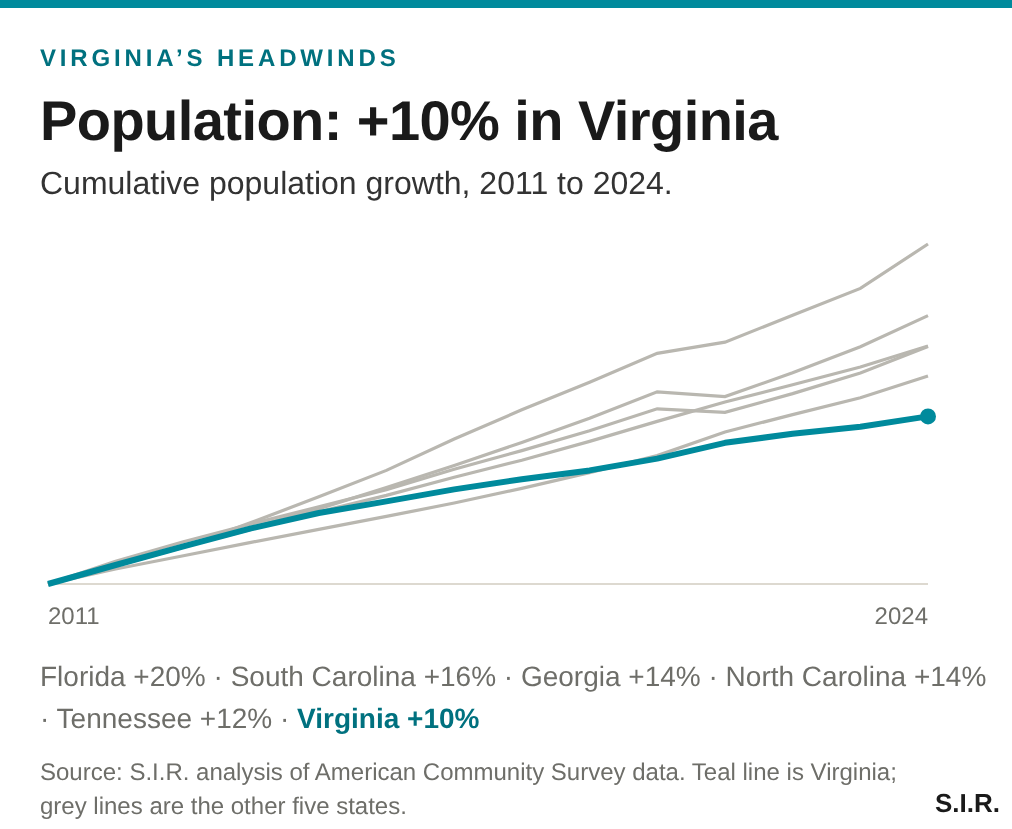
Virginia’s population grew 10% from 2011 to 2024. The other five states grew between 12% (Tennessee) and 20% (Florida).
Jobs
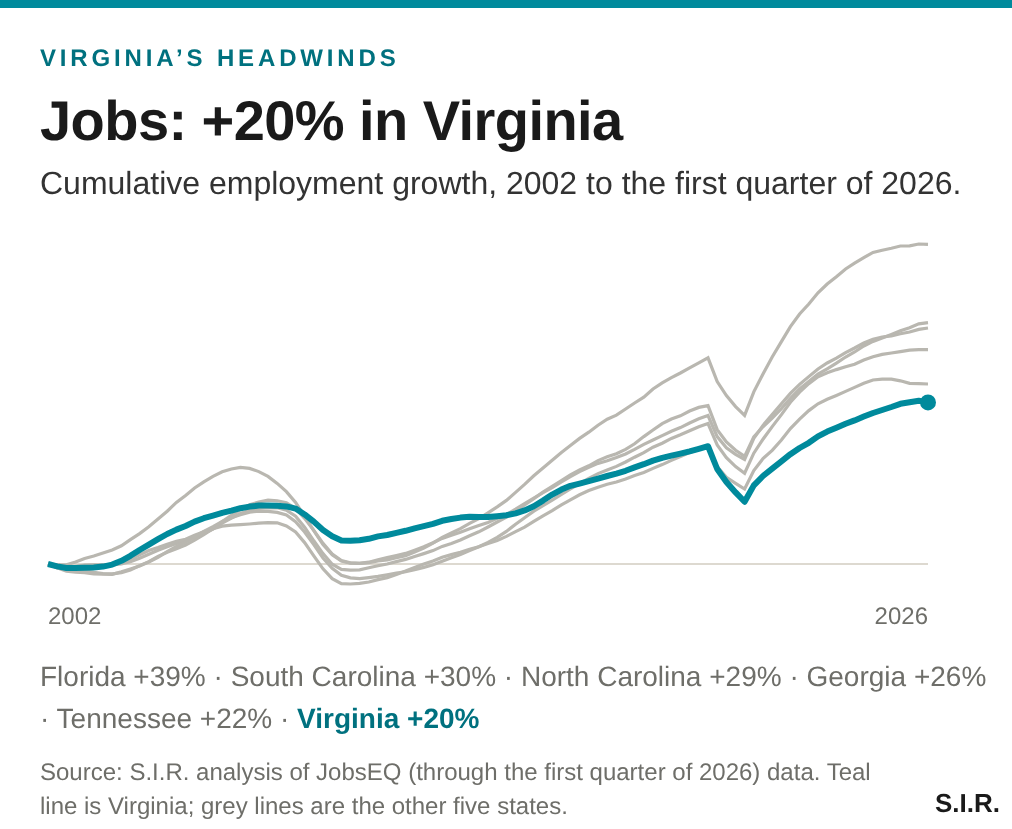
From 2002 to early 2026, employment in Virginia grew 20%. Tennessee, the next slowest, grew 22%; Florida grew 39%. Virginia lost less ground than its neighbors in the 2008 to 2010 downturn, which is why it led for a time. Since the mid-2010s the other five have added jobs faster.
Economic output
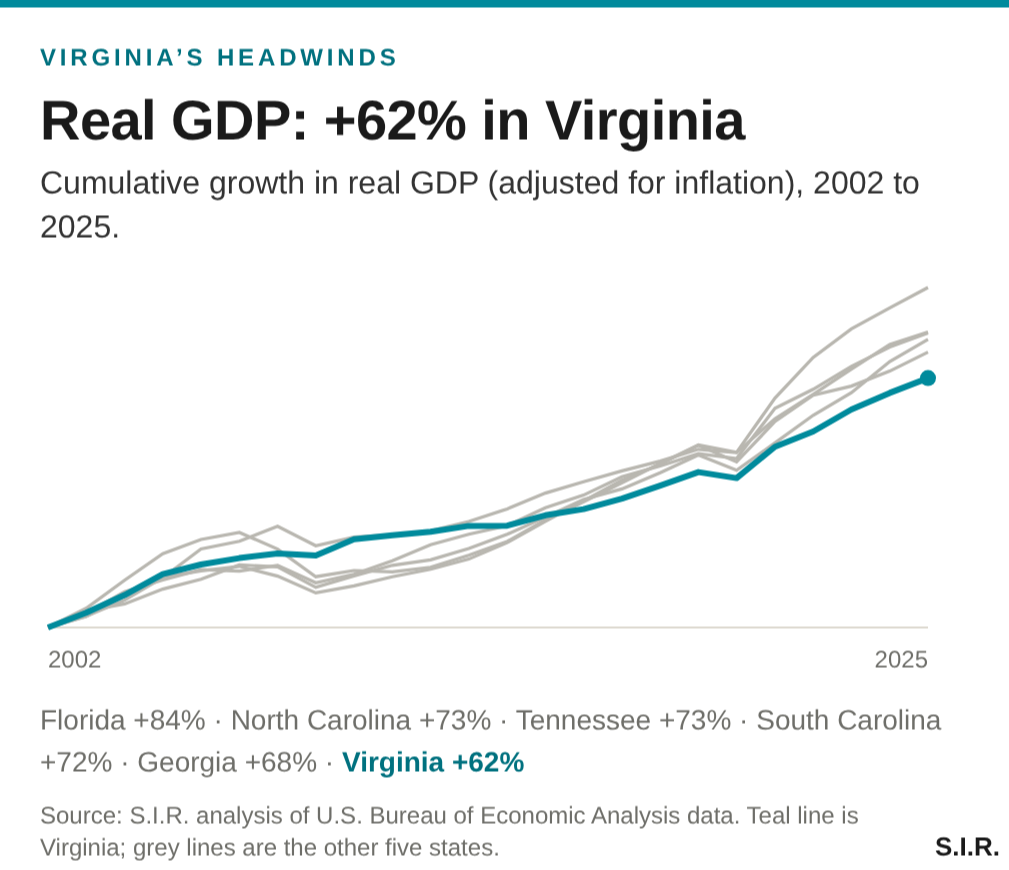
Virginia’s real GDP, the value of everything the state produces after adjusting for inflation, grew 62% from 2002 to 2025. Georgia, the next slowest, grew 68%; Florida grew 84%.
Why these three
Population, jobs and output move together. People bring talent and demand; employers follow talent; output follows both. A state can post a strong year on one of them. Ranking last on all three is a pattern, not a blip.
What we’re looking at next
This is the first in a monthly series from S.I.R.’s research team on Virginia’s headwinds. Next month: what the difference adds up to.
How we measured it. Cumulative percent change from the first year shown, for each state. Population: American Community Survey, 2011 to 2024. Jobs: JobsEQ, quarterly, 2002 through the first quarter of 2026. Economic output: U.S. Bureau of Economic Analysis, real GDP by state in chained 2017 dollars, 2002 to 2025. Rankings compare the six states’ cumulative growth at each point in time.